
You want your business to do well. But how do you know what’s working? Performance analytics gives you the answers. It uses data to show clear facts. You spot issues fast. You make smart fixes. This guide helps you get it. We cover the basics and more. By the end, you’ll see why it’s a must-have.
Contents
- 1 What Is Performance Analytics?
- 2 Benefits of Performance Analytics
- 3 Key Features of Performance Analytics Tools
- 4 How Performance Analytics Works
- 5 How to Set Up Performance Analytics in Your Business
- 6 Real Business Examples That Show It Works
- 7 Top Performance Analytics Tools Compared
- 8 Frequently Asked Questions
- 8.1 What does performance analytics cost?
- 8.2 Do I need tech skills to use it?
- 8.3 How is it different from basic reports?
- 8.4 Can small businesses use it?
- 8.5 What if my data is messy?
- 8.6 How often should I check analytics?
- 8.7 Does it work with AI?
- 8.8 What industries use it most?
- 8.9 Can it help with team goals?
- 8.10 Is data safe?
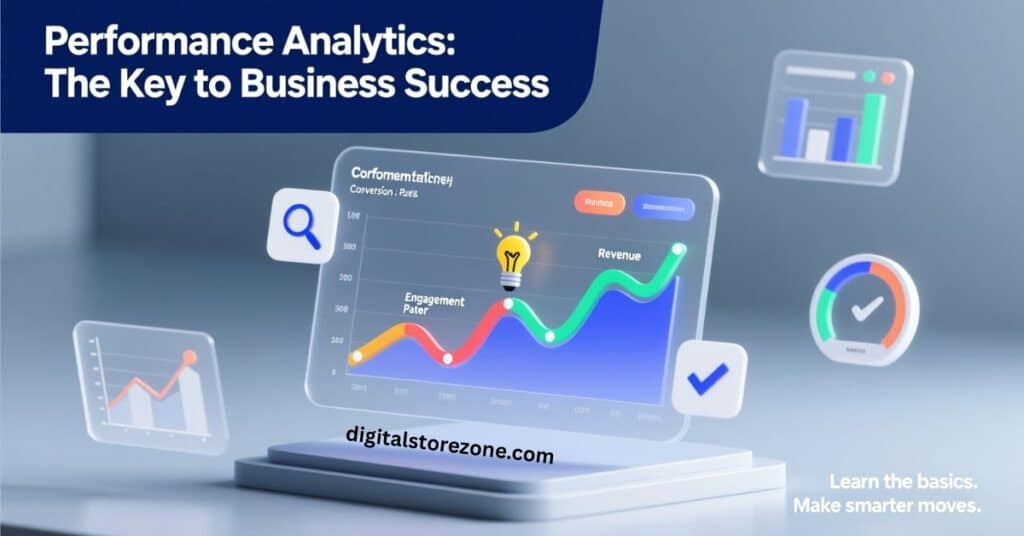
What Is Performance Analytics?
Performance analytics tracks how well things work. Think of it as a report card for your business. It looks at key areas like sales or service. You get real-time info. No more guesses.
In simple terms, it collects data from your daily work. Then it turns that into easy charts. You see patterns. For example, if sales drop on Fridays, you know why. Tools like these put data in your hands. They help teams make quick calls.
Many firms use it for IT or customer help. But it fits any field. It’s about better choices with facts.
Benefits of Performance Analytics
Why bother with this? It saves time and cash. Here are the main wins.
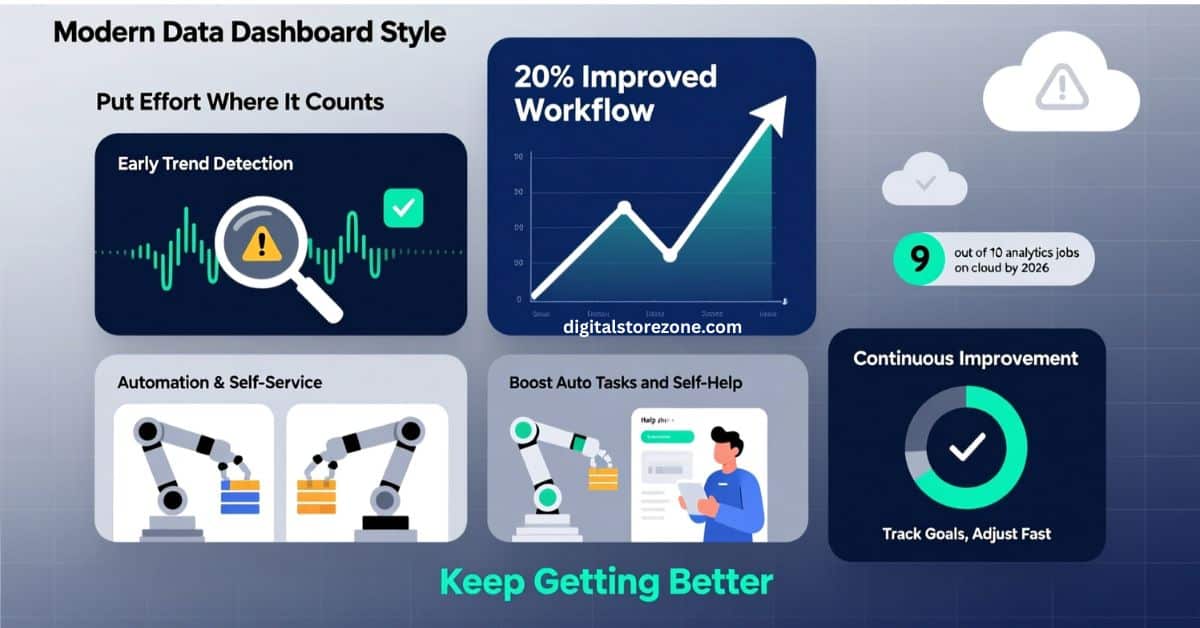
- Spot Trends Before They Hurt. You watch data live. Catch slow spots early. Fix them quick. This stops big problems.
- Put Effort Where It Counts. See what needs help most. Shift your team there. No waste on low stuff.
- Boost Auto Tasks and Self-Help. Find where machines can take over. Or let customers fix their own issues. This frees up your crew.
- Keep Getting Better. Use charts to track goals. See what’s up or down. Adjust as you go.
Stats show big gains. By 2026, nine out of ten analytics jobs run on cloud setups. This makes things faster and cheaper. Firms that use it see up to 20% better work flow. You get ahead of rivals.
Key Features of Performance Analytics Tools
Good tools have these must-haves. They make data simple to use.
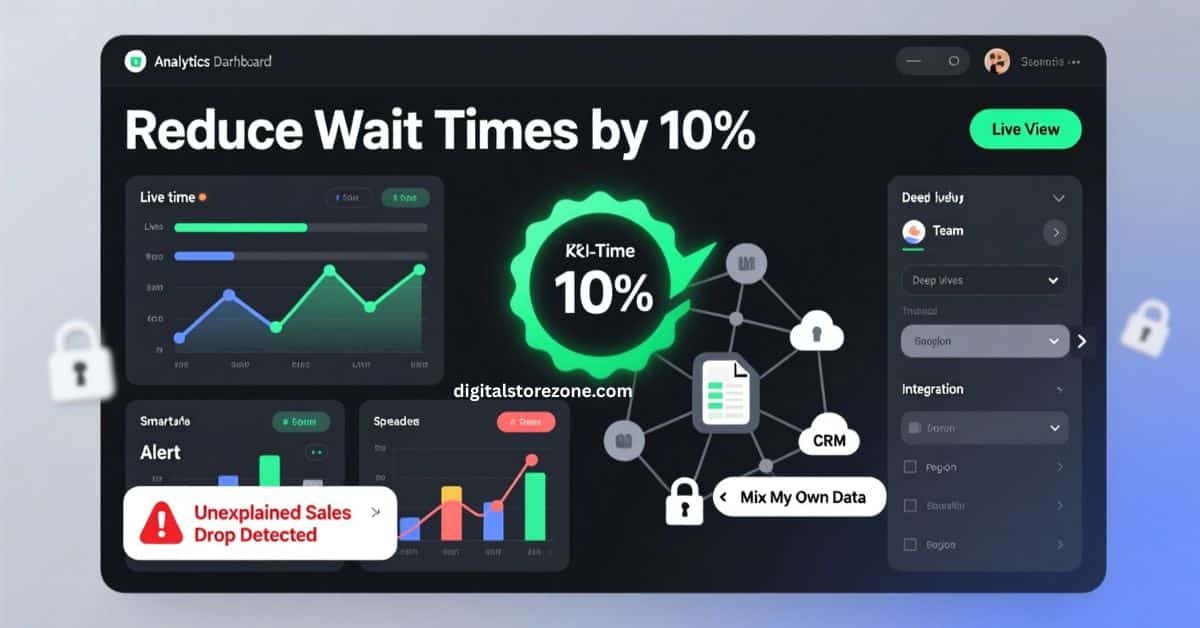
- KPIs and Dashboards. Set goals like “cut wait times by 10%.” Dashboards show progress in one spot. Easy to read.
- Live Views. Get updates now, not later. Answer questions on the spot.
- Smart Alerts. Tools spot odd changes. They ping you. Like if sales dip without cause.
- Deep Dives. Break data by team or time. See why things happen.
- Safe and Big Scale. Data stays locked. Tools grow with you. No crashes.
- Mix Your Own Data. Pull in info from spreadsheets or other spots. Get the full view.
These help you trust your facts. No more scattered files.
How Performance Analytics Works
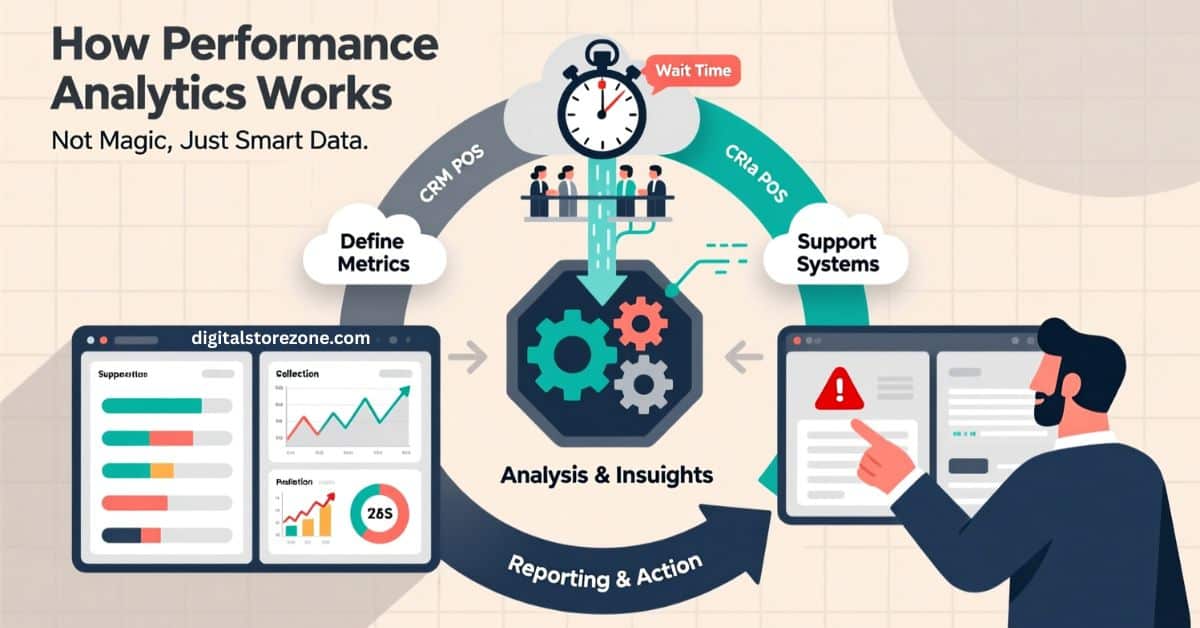
It’s not magic. Here’s the flow.
First, pick what to measure. Like customer wait times.
Next, tools grab data from your systems.
Then, they crunch the numbers. Make forecasts or spot trends.
Last, you see it all in reports. You act on it.
Simple loop: Watch, learn, fix, repeat.
How to Set Up Performance Analytics in Your Business
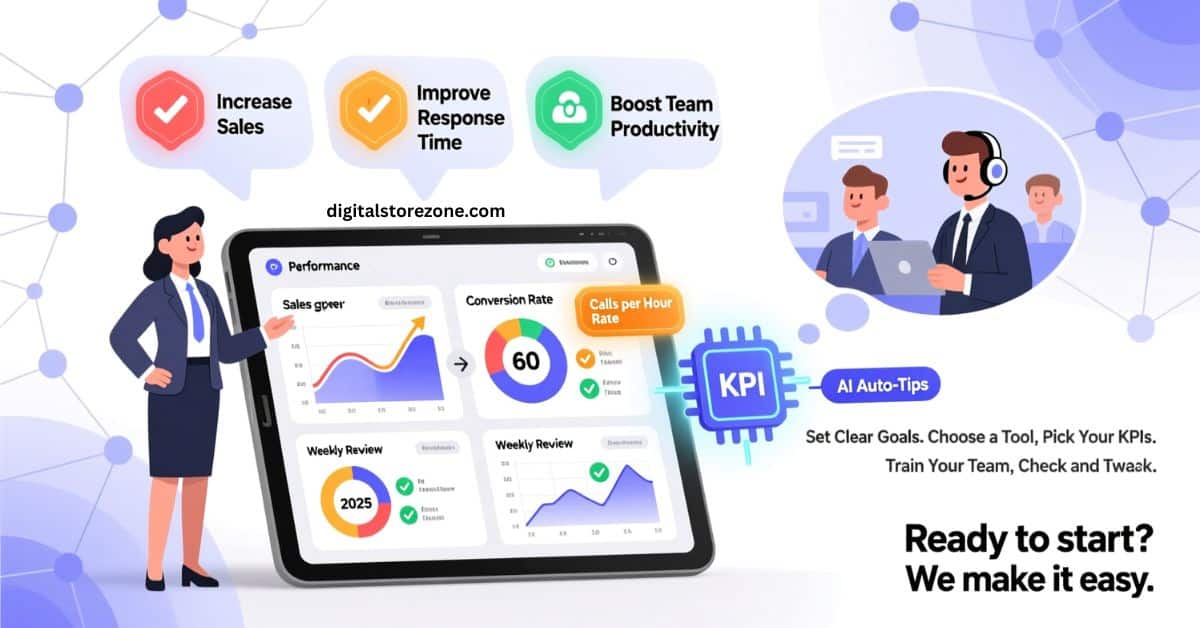
Ready to start? Follow these steps. We make it easy.
- Set Clear Goals. What do you want? More sales? Faster help? Pick three to start.
- Choose a Tool. Look at your needs. Small team? Try free ones. Big firm? Go for full sets.
- Pick Your KPIs. Choose measures that matter. Like “calls per hour” for support.
- Train Your Team. Show them how to use it. Keep it short. One hour max.
- Check and Tweak. Look at data each week. Change what doesn’t work.
This takes a few weeks. But you see wins fast. Add AI for auto tips. By 2025, AI drives most analytics trends.
Real Business Examples That Show It Works
See how others win with this. These stories prove the point.
One payment firm swapped old tools for performance analytics. They got one spot for all data. Teams made faster calls. Work got smoother. They cut costs too.
A fast-food chain used it for staff data. They boosted happy customers by 10%. Turnover dropped. They linked pay to performance. Sales went up.
In retail, a shop tracked product views. They fixed slow pages. Sales rose 15%. Simple changes from data.
These show real cash saved. You can do the same.
Top Performance Analytics Tools Compared
Not sure which tool? Here’s a quick look at five top ones for 2025. We picked based on ease and power.
| Tool | Key Features | Pros | Cons |
|---|---|---|---|
| ServiceNow | Live alerts, dashboards, mix data | Safe for big firms, full IT fit | Costs more for small teams |
| Tableau | Great charts, easy share | Fun to use, quick setup | Needs training for deep stuff |
| Power BI | Cloud run, AI tips | Cheap, works with Microsoft | Less for non-Windows |
| Mixpanel | User tracks, event alerts | Good for apps, real-time | Focus on products only |
| Google Analytics | Free basics, web focus | No cost start, big data | Privacy rules can limit |
Conclusion
You’ve seen how performance analytics turns raw data into real wins. It spots trends, cuts waste, and drives smart choices. In 2026, businesses that skip this fall behind. Don’t wait—pick a tool, set your goals, and track progress today. Your team will thank you, and your bottom line will soar. Ready to unlock peak performance? Start now and watch the growth happen.
Frequently Asked Questions
Got questions? We have answers. Here are common ones.
What does performance analytics cost?
It varies. Free tools start at zero. Full ones run $10 to $100 per user each month. Check your needs.
Do I need tech skills to use it?
No. Most tools are drag and drop. You learn fast.
How is it different from basic reports?
Reports show past. Analytics predicts future. It spots why things happen.
Can small businesses use it?
Yes. Free options like Google work great for starters.
What if my data is messy?
Tools clean it up. They pull from many spots.
How often should I check analytics?
Daily for key stuff. Weekly for big views.
Does it work with AI?
Yes. Many add AI for auto alerts. Big trend in 2025.
What industries use it most?
All. But IT, sales, and HR lead.
Can it help with team goals?
Sure. Track work and give feedback.
Is data safe?
Top tools use locks and rules. Pick ones that fit laws.